ELK日志分析系统部署
什么是ELK?
ELK日志分析系统是一个对于日志的收集然后展示出来的一个日志管理平台,也是一个架构E代表Elasticsearch,L代表Logstash,而K代表的是Kibana,有这三个服务组成的一个架构就是所说的ELK日志分析系统三大组件的作用:
Logstash:收集服务器上的日志,将日志格式化,对数据加工
Elasticsearch:对收集到的数据进行索引分类,并存储起来
Kibana:对数据以前端的方式展示
ELK架构(如下图所示)
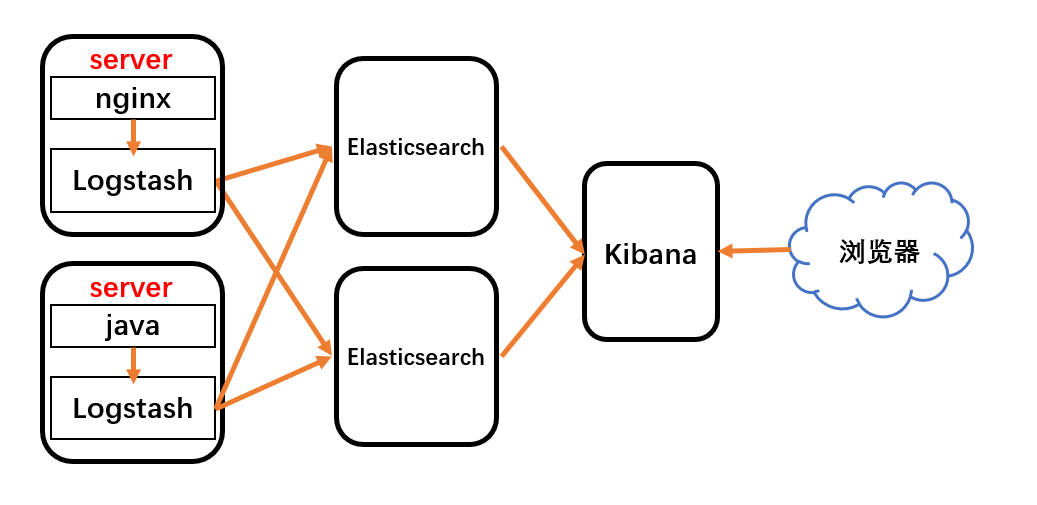
大体流程就是服务器上安装Logstash收集应用日志,然后将数据格式化输出到Elasticsearch服务或者集群进行索引分类存储,然后再将数据用Kibana进行展示查看
★准备工作★
一共需要三台服务器
one(Elasticsearch、Kibana):192.168.31.101
two(Elasticsearch):192.168.31.102
three(Logstash、Nginx):192.168.31.103
安装包详情:
elasticsearch-8.3.3-linux-x86_64.tar.gz
node-v16.14.2-linux-x64.tar.gz
logstash-8.3.3-linux-x86_64.tar.gz
kibana-8.3.3-linux-x86_64.tar.gz
安装包下载地址:
Elasticsearch下载地址:https://artifacts.elastic.co/downloads/elasticsearch/elasticsearch-8.3.3-linux-x86_64.tar.gz
Logstash下载地址:https://artifacts.elastic.co/downloads/logstash/logstash-8.3.3-linux-x86_64.tar.gz
node下载地址:https://nodejs.org/dist/v16.14.2/node-v16.14.2-linux-x64.tar.gz
Kibana下载地址:https://artifacts.elastic.co/downloads/kibana/kibana-8.3.3-linux-x86_64.tar.gz
配置host文件
vim /etc/hosts
---------------------
192.168.31.101 one
192.168.31.102 two
192.168.31.103 three
三台服务器都安装jdk环境
[root@node1 ~]# java -version
java version "1.8.0_333"
Java(TM) SE Runtime Environment (build 1.8.0_333-b02)
Java HotSpot(TM) 64-Bit Server VM (build 25.333-b02, mixed mode)
部署ELK日志分析系统
安装配置Elasticsearch
192.168.31.101、192.168.31.102都需要安装:
1.下载安装elasticsearch,创建工作目录
tar zxf elasticsearch-8.3.3-linux-x86_64.tar.gz
mv elasticsearch-8.3.3 /usr/local/elasticsearch
mkdir -p /usr/local/elasticsearch/{data,logs}
2.配置配置elasticsearch文件
vim /usr/local/elasticsearch/config/elasticsearch.yml
----------------------------------------
cluster.name: my-elk-cluster #指定群集名字
node.name: one #设置节点名
network.host: 0.0.0.0 #允许外部 ip 访问
http.port: 9200 #设置监听端口
path.data: /usr/local/elasticsearch/data #数据存储目录
path.logs: /usr/local/elasticsearch/logs  #日志目录
#集群发现通过单播实现,指定要发现的节点
discovery.seed_hosts: ["one", "two"]
cluster.initial_master_nodes: ["one"]
xpack.security.enabled: false
这里192.168.31.102的配置文件节点名字改为two,其他不变
elasticsearch.8.x版本需要配置安全认证功能否则会报错,也就是xpack.security.enabled配置项
3.创建用户并授权
groupadd es
useradd es -g es -p es
chown -R es.es /usr/local/elasticsearch
4.系统优化
vim /etc/security/limits.conf
---------------------------------
* soft nofile 65535  #最多只能打开65535个文件数,超过就会报警
* hard nofile 65535 #严格设定不允许超过
* soft nproc 4096
* hard nproc 4096
elk hard nofile 65536
elk soft nofile 65536
soft xxx : 代表警告的设定,可以超过这个设定值,但是超过后会有警告
hard xxx : 代表严格的设定,不允许超过这个设定的值。
nofile : 是每个进程可以打开的文件数的限制
nproc : 是操作系统级别对每个用户创建的进程数的限制
vim /etc/sysctl.conf
---------------------
vm.max_map_count=655360
sysctl -p
5.使用es用户启动elasticsearch服务
注意:使用root用户启动会报错
su - es -c "/usr/local/elasticsearch/bin/elasticsearch -d"
配置elasticsearch服务管理
vim /usr/lib/systemd/system/elasticsearch.service
--------------------------------------------
[Unit]
Description=elasticsearch server daemon
After=network.target sshd-keygen.target

[Service]
Type=simple
ExecStart=/usr/local/elasticsearch/bin/elasticsearch -d
ExecReload=kill -HUP $MAINPID
User=es
Group=es
LimitNOFILE=65535
LimitNPROC=65535
Restart=no
PrivateTmp=true

[Install]
WantedBy=multi-user.target
重新加载systemctl服务
systemctl daemon-reload
systemctl enable --now  elasticsearch
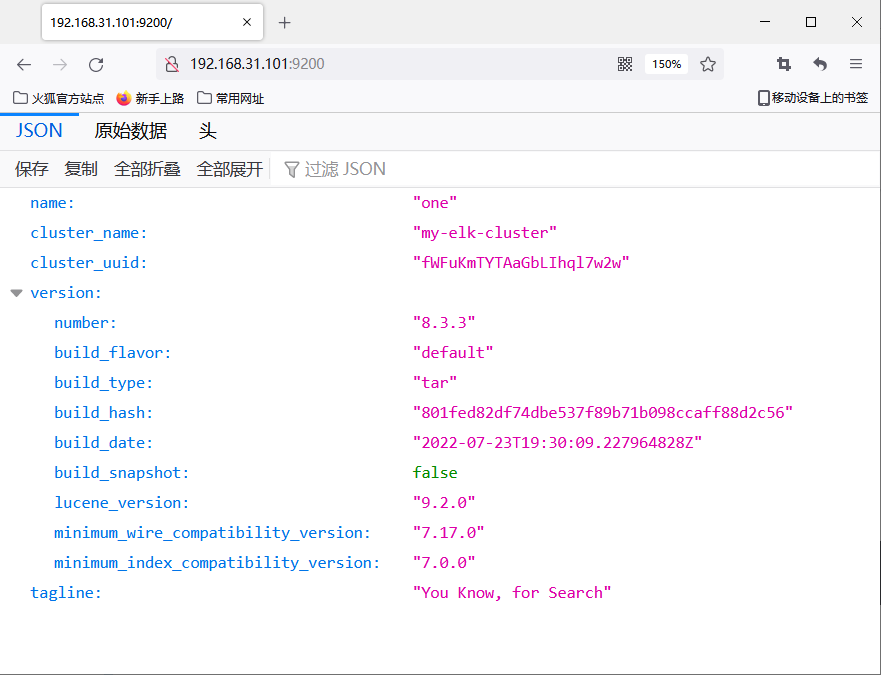
访问9200端口,也就是192.168.31.101:9200和192.168.31.102:9200(如下图所示)
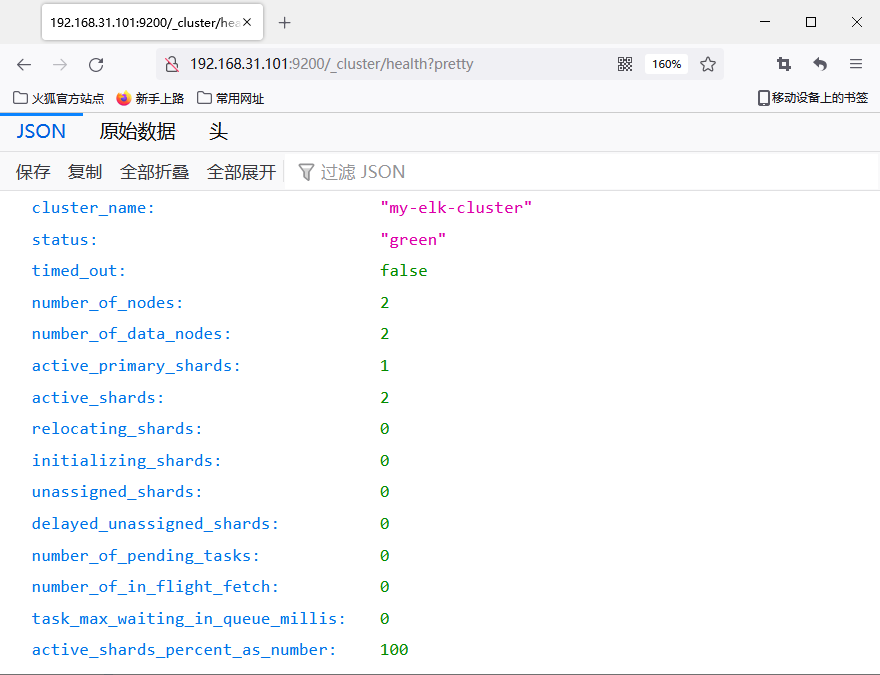
访问/_cluster/health?pretty接口查看群集信息,比如访问192.168.31.101:9200/_cluster/health?pretty(如下图所示)
安装Elasticsearch-head插件
1.安装node.js
tar zxf node-v16.14.2-linux-x64.tar.gz
mv node-v16.14.2-linux-x64 /usr/local/node
ln -s /usr/local/node/bin/* /usr/bin
2.安装elasticsearch-head
修改elasticsearch配置文件
vim /usr/local/elasticsearch/config/elasticsearch.yml
-------------------------------
http.cors.enabled: true #支持跨域
http.cors.allow-origin: "*" #*表示所有域名
下载源码编译安装
git clone https://github.com/mobz/elasticsearch-head.git
cd elasticsearch-head
npm install --registry=https://registry.npm.taobao.org
npm run start &
或者源码包下载
安装phantomjs
yum -y install fontconfig-devel
wget https://github.com/Medium/phantomjs/releases/download/v2.1.1/phantomjs-2.1.1-linux-x86_64.tar.bz2
tar jxf phantomjs-2.1.1-linux-x86_64.tar.bz2
cp phantomjs-2.1.1-linux-x86_64/bin/phantomjs /usr/local/bin/
安装启动elasticsearch-head
wget https://codeload.github.com/mobz/elasticsearch-head/tar.gz/refs/tags/v5.0.0
tar zxf elasticsearch-head-5.0.0.tar.gz
cd elasticsearch-head-5.0.0
npm install
npm audit fix
npm audit fix --force
nohup npm run start &
重启elasticsearch服务
pkill java
su - es -c "/usr/local/elasticsearch/bin/elasticsearch -d"
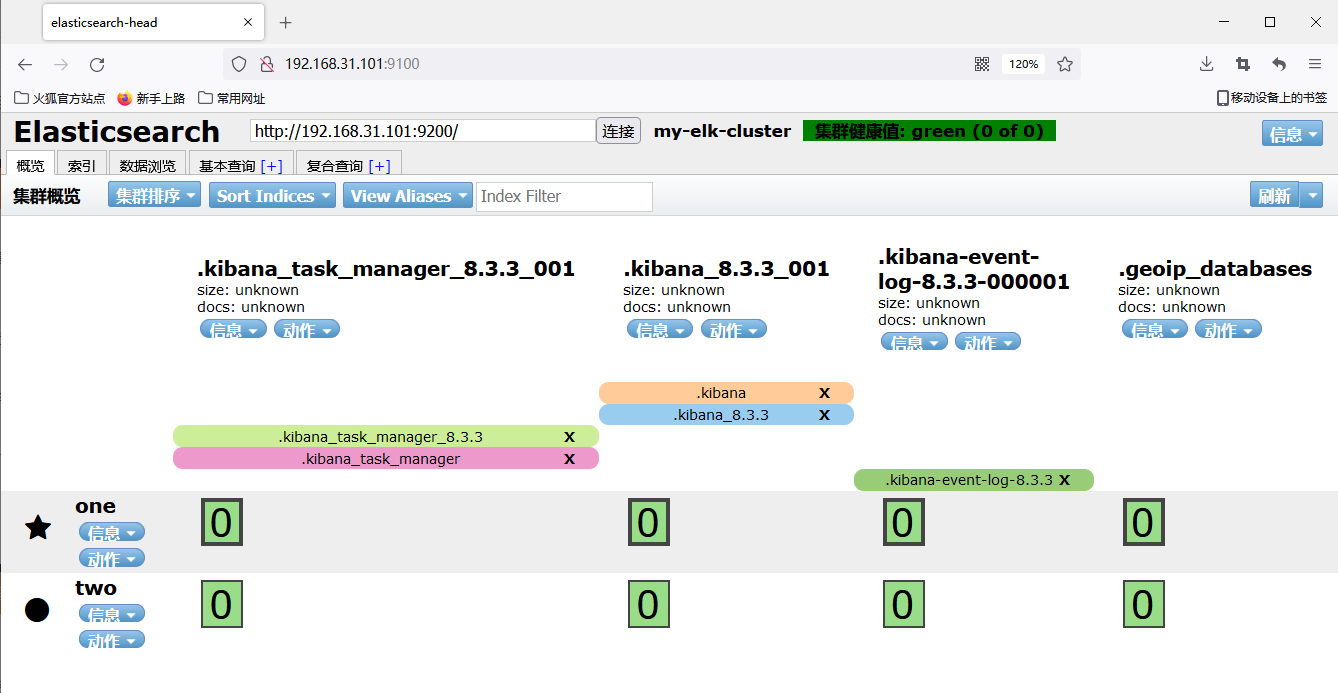
访问9100端口,也就是192.168.31.101:9100(如下图所示)
安装配置Logstach
1.下载解压安装logstach
tar zxf logstash-8.3.3-linux-x86_64.tar.gz
mv logstash-8.3.3 /usr/local/logstash
2.修改logstach配置文件
vim /usr/local/logstash/conf/nginx_log.conf
----------------------------------
input {
  file{
    path => "/var/log/nginx/access.log"
    type => "access"
    start_position => "beginning"
  }
  file{
    path => "/var/log/nginx/error.log"
    type => "error"
    start_position => "beginning"
  }
}
output {
  if [type] == "access" {
    elasticsearch {
      hosts => ["192.168.31.101:9200"]
      index => "nginx_access-%{+YYYY.MM.dd}"
    }
  }
  if [type] == "error" {
    elasticsearch {
      hosts => ["192.168.31.102:9200"]
      index => "nginx_error-%{+YYYY.MM.dd}"
    }
  }
}
3.启动logstach服务
nohup /usr/local/logstash/bin/logstash -f /usr/local/logstash/conf/nginx-log.conf &
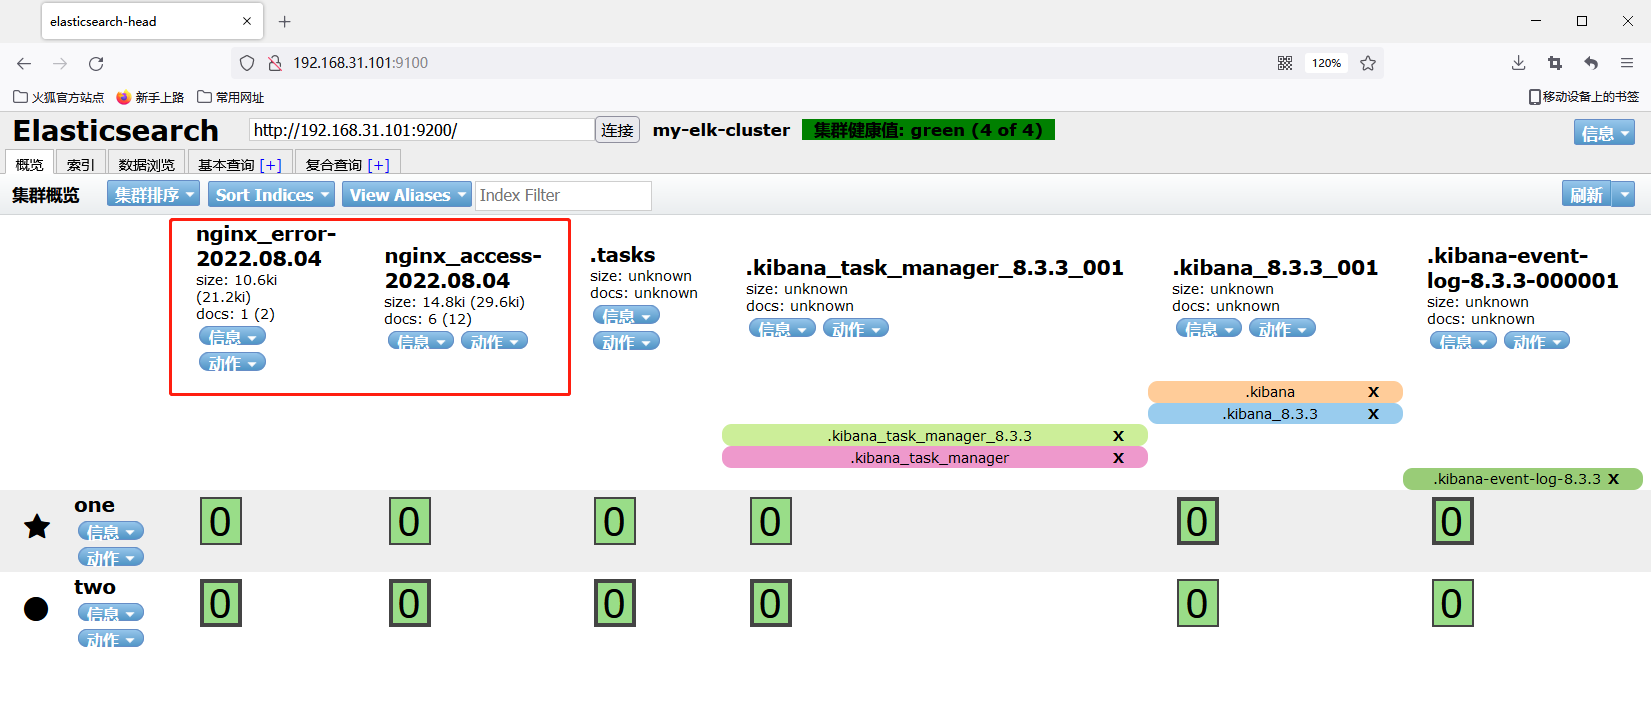
启动之后再访问192.168.31.101:9100,发现增加了两个索引,正是我们创建的(如下图所示)
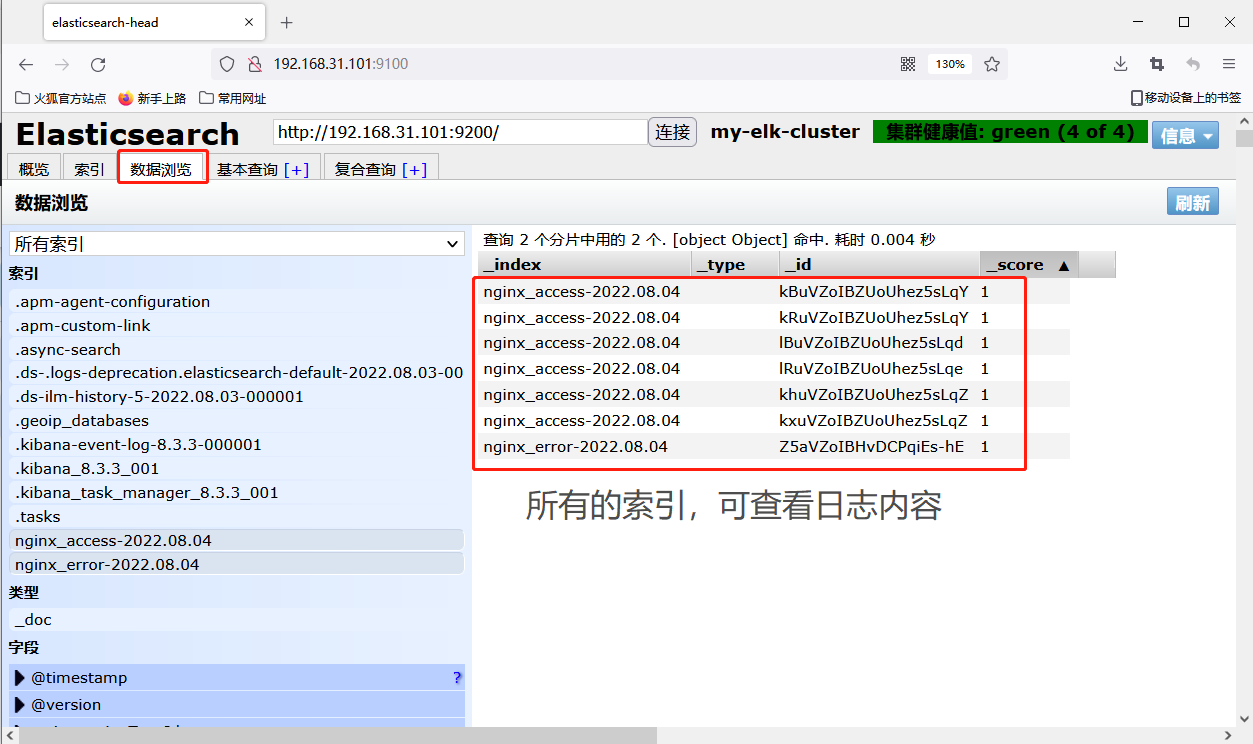
我们可以在数据浏览中查看索引数据(如下图所示)
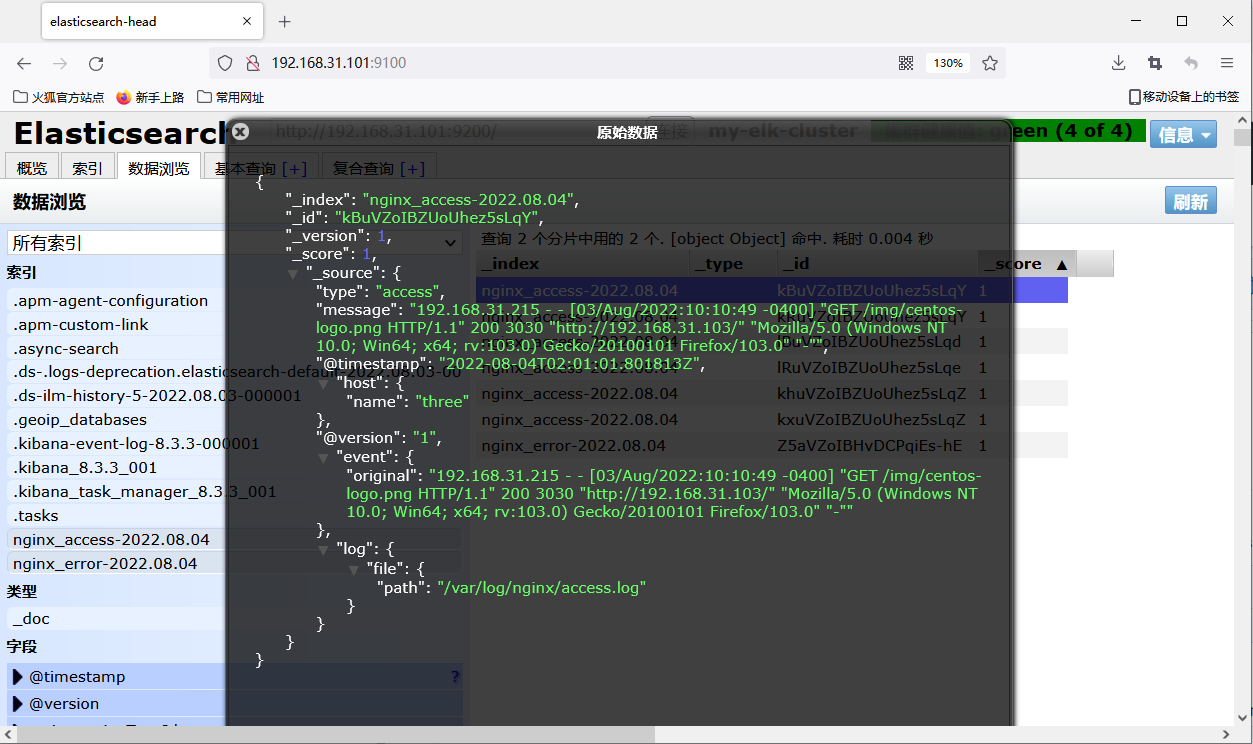
我们随便点开一个数据,查看里面的值,有很多字段,message就是我们的日志内容(如下图所示)
安装配置Kibana
1.下载安装kibana
tar zxf kibana-8.3.3-linux-x86_64.tar.gz
mv kibana-8.3.3 /usr/local/kibana
2.创建用户并授权
groupadd kibana
useradd kibana -g kibana -p kibana
chown -R kibana:kibana /usr/local/kibana
3.修改kibana配置文件
vim /usr/local/kibana/config/kibana.yml
------------------------
# 服务端口
server.port: 5601
# 服务器ip  本机
server.host: "0.0.0.0"
# Elasticsearch 服务地址
elasticsearch.hosts: ["http://localhost:9200"]
# 设置语言为中文
i18n.locale: "zh-CN"
4.启动kibana服务
su - kibana -c "/usr/local/kibana/bin/kibana &"
访问5601端口页面,也就是192.168.31.101:5601
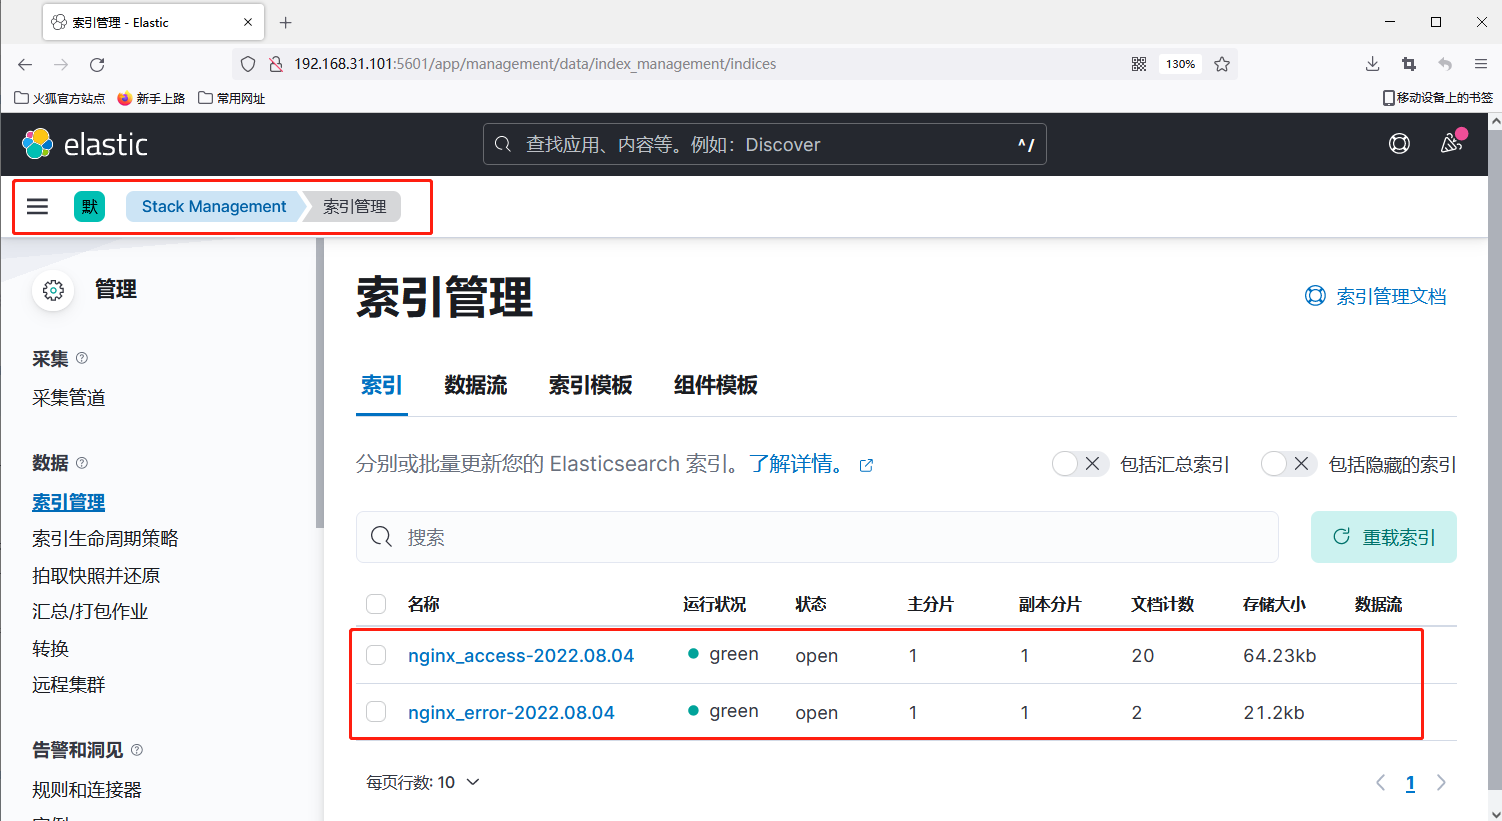
我们可以在索引管理中查看可用的索引(如下图所示)
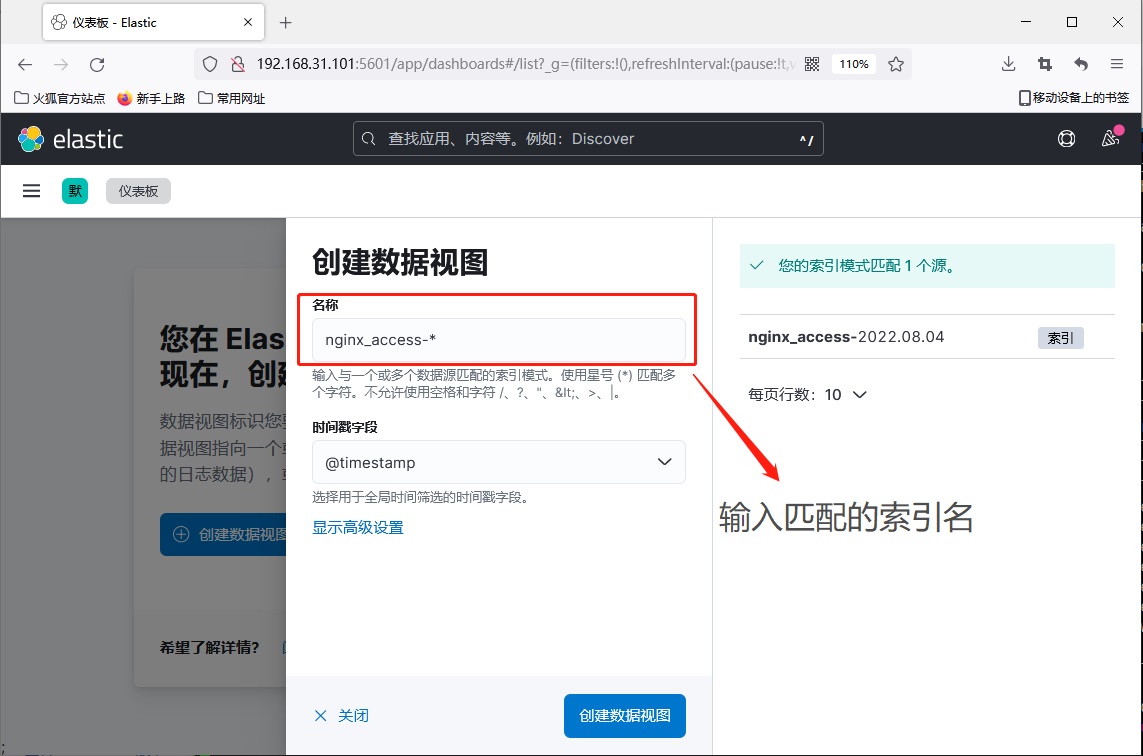
首先我们要先创建数据试图,输入索引名字后面跟*号可以匹配出想关索引(如下图所示)
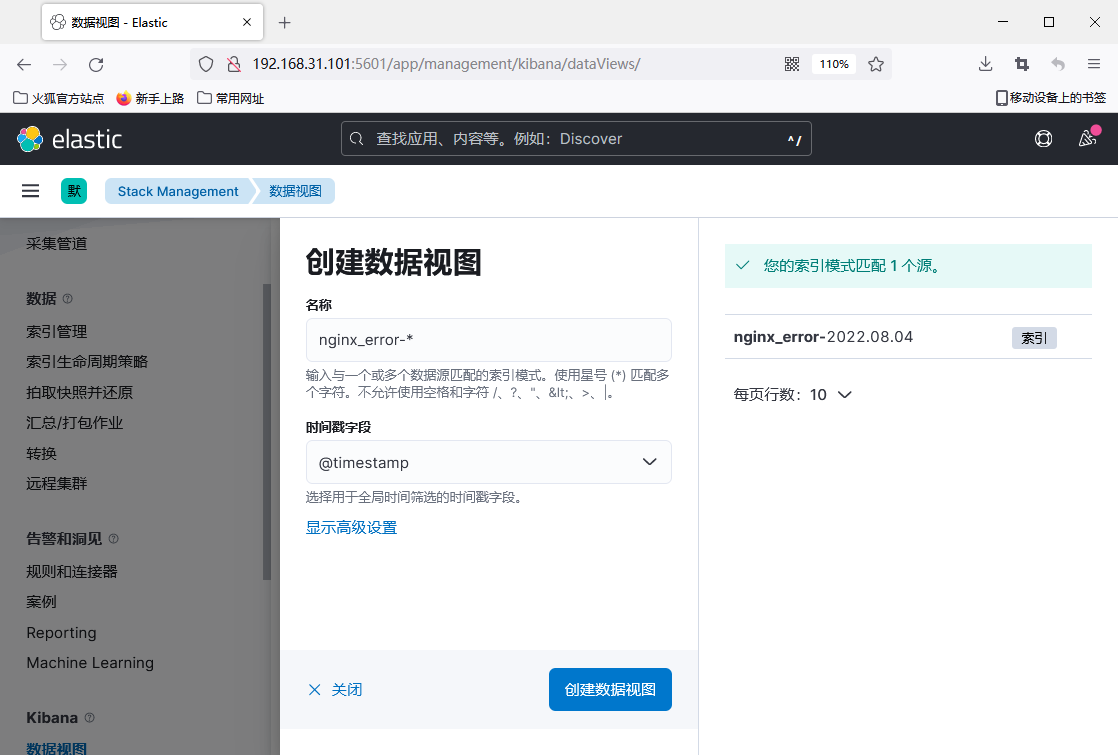
我们第二个索引也是一样的(如下图所示)
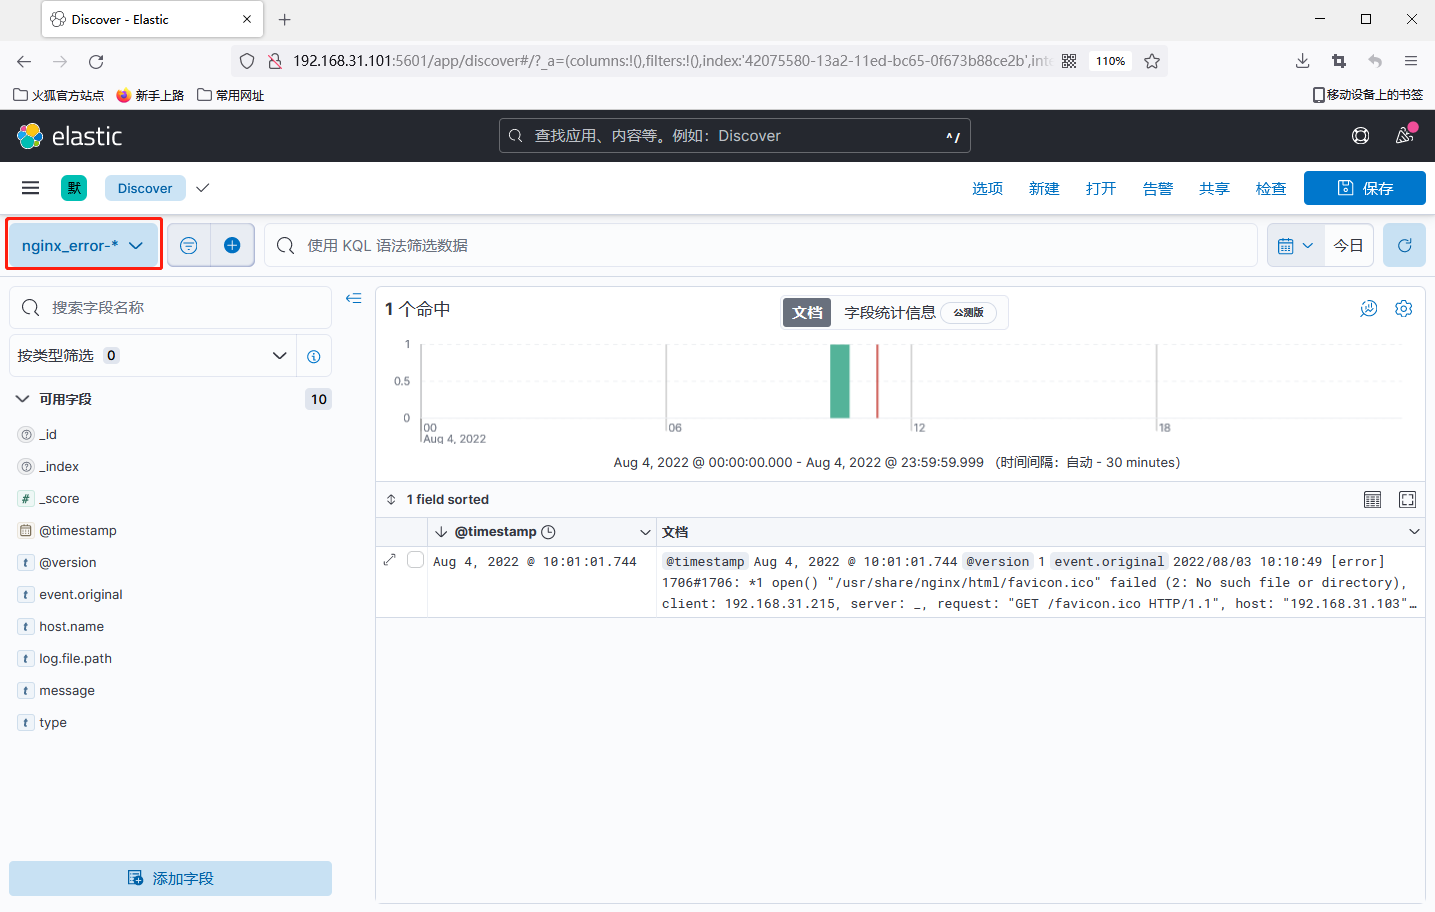
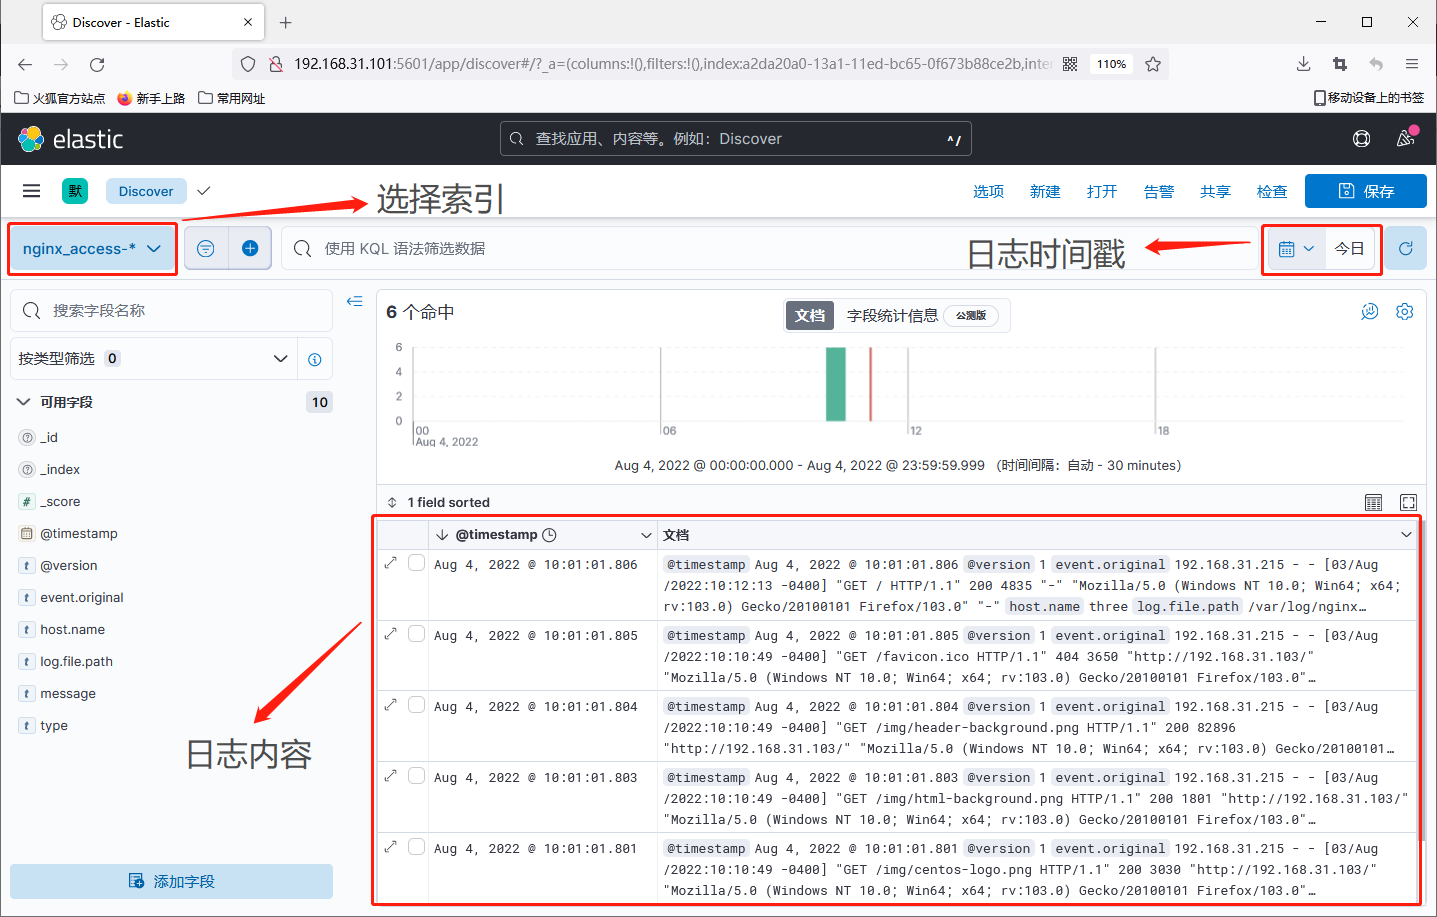
创建好了之后我们可以在Discover界面去查看日志和图像,先选择索引名,再选择时间段,然后就可以看到日志的信息
注意:这个时间段是根据日志生成的时间字段去判断的,不是根据你的时间
我们这里先看nginx_access-*相关的日志,图像上可以看到日志分片生成的时间和分片数量(如下图所示)
查看nginx_error-*相关的日志也是跟上面一样的(如下图所示)